
Active Directory plays a major role in today´s networks. It is very important that is properly configured and secured and that provides high availability in case of failure of one or more servers. If bad guys compromised our Active Directory, our network and all services that are integrated with Active Directory might be comprised, too. That is the last thing we want to experience. There are different security mechanisms that can help us to harden our Active Directory servers and mitigate security risk, but also to monitor what is happening inside and outside of the Active Directory environment.
Many security compromises could be discovered early in the event logs. The 2012 Verizon Data Breach Report found that even though 85 percent of breaches took several weeks to be noticed, 84 percent of victims had evidence of the breach in their event logs. This article is about monitoring event logs which can lead us to potential security problems. Here is the story I want to share with you: if trusted domain information was modified or system audit policy was changed > Active Directory will generate event ID 620 and 612 > store it to the corresponding log file > the monitoring software will capture it and inform the IT Team to act immediately. These two IDs are just an example, Active Directory can generate way more events which will be covered in the next part of the article. There are dozens of monitoring solutions that can be used to monitor event logs, but the one I recommend is PRTG Network Monitor. Besides the monitoring of event logs, PRTG can also monitor the complete infrastructure by using different protocols.
“The apparent ineffectiveness of event monitoring and log analysis continues to be somewhat of an enigma. The opportunity for detection is there; investigators noted that 66 percent of victims had sufficient evidence available within their logs to discover the breach had they been more diligent in analyzing such resources.”
MICROSOFT
ACTIVE DIRECTORY EVENT IDs
In the table below you can find a list of some events that might be generated by your Active Directory server(s). The Current Windows Event ID column lists the events ID in the supported version of Windows Servers, and the Legacy Windows Event ID is related to legacy Windows Servers, such as Windows Server 2003. I hope the legacy list will not be related to your case, but if yes, please update your Windows Servers to the latest version available.
There are three potential criticalities including high, medium and low. According to Microsoft, a potential criticality of High means that one occurrence of the event should be investigated. Potential criticality of Medium or Low means that these events should only be investigated if they occur unexpectedly or in numbers that significantly exceed the expected baseline in a measured period of time.
Note: All organizations should test these recommendations in their environments before creating alerts that require mandatory investigative responses. Every environment is different, and some of the events ranked with a potential criticality of High may occur due to other harmless events.
| Current Windows Event ID | Legacy Windows Event ID | Potential Criticality | Event Summary |
|---|---|---|---|
| 4618 | N/A | High | A monitored security event pattern has occurred. |
| 4649 | N/A | High | A replay attack was detected. May be a harmless false positive due to misconfiguration error. |
| 4719 | 612 | High | System audit policy was changed. |
| 4765 | N/A | High | SID History was added to an account. |
| 4766 | N/A | High | An attempt to add SID History to an account failed. |
| 4794 | N/A | High | An attempt was made to set the Directory Services Restore Mode. |
| 4897 | 801 | High | Role separation enabled: |
| 4964 | N/A | High | Special groups have been assigned to a new logon. |
| 5124 | N/A | High | A security setting was updated on the OCSP Responder Service |
| 1102 | 517 | Medium to High | The audit log was cleared |
| 4692 | N/A | Medium | Backup of data protection master key was attempted. |
| 4706 | 610 | Medium | A new trust was created to a domain. |
| 4713 | 617 | Medium | Kerberos policy was changed. |
| 4715 | N/A | Medium | The audit policy (SACL) on an object was changed. |
| 4716 | 620 | Medium | Trusted domain information was modified. |
| 4816 | N/A | Medium | RPC detected an integrity violation while decrypting an incoming message. |
| 4625 | 529-537,539 | Low | An account failed to log on. |
| 4648 | 552 | Low | A logon was attempted using explicit credentials. |
| 4657 | 567 | Low | A registry value was modified. |
PRTG DOES ALL THE WORK
Two PRTG sensors that can be used to monitor event logs are the WMI Event Log sensor and the Windows API Event Log sensor. The WMI Event Log sensor monitors a specific Windows logfile via Windows Management Instrumentation (WMI). The Event Log (Windows API) sensor monitors Event Log entries using the Windows application programming interface (API).
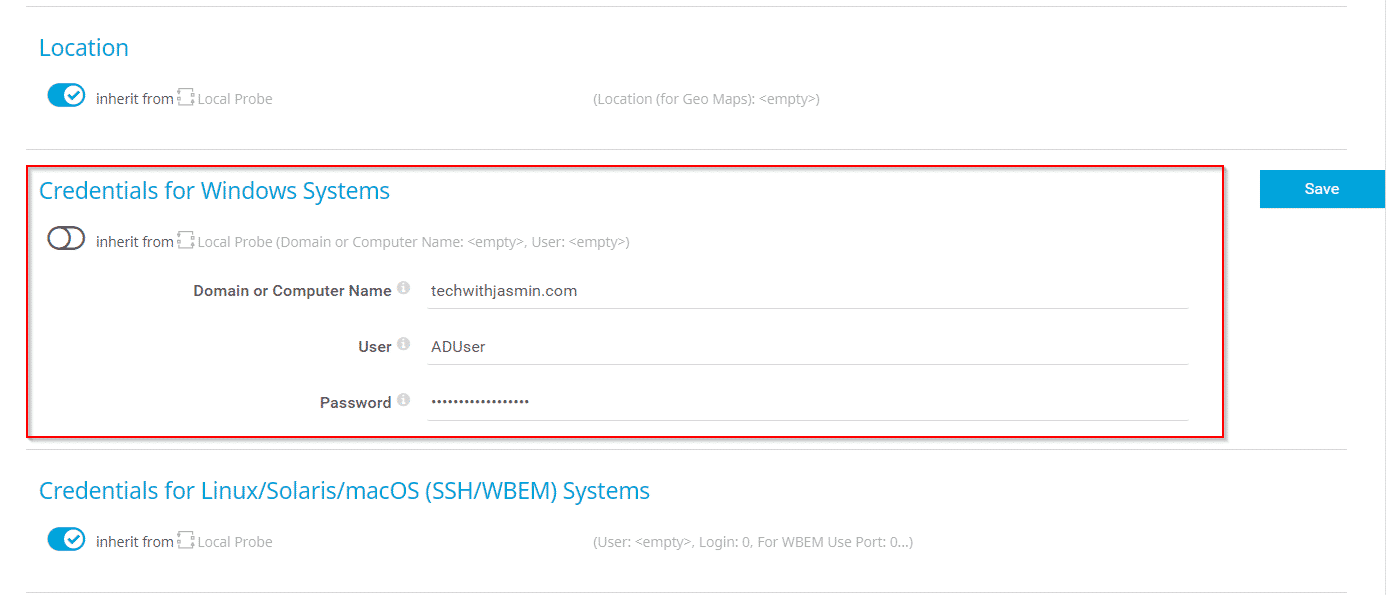
In the first step, you will need to add your Active Directory server as a device in the PRTG. In order to query the Active Directory server using WMI or API, you will need also to add credentials to PRTG Core Server.
In the second step, you will need to choose one of the event log sensors and add it to your device. The initial configuration of the sensor is straightforward, choose Logfile Security and then enable Filter by ID and add the event ID in field Match Values (Event ID), as shown in the screenshot below. In this case, PRTG will scan ID 4719 which is related to any system audit policy change. PRTG will check target ID every 60 seconds (default interval, can be adjusted).
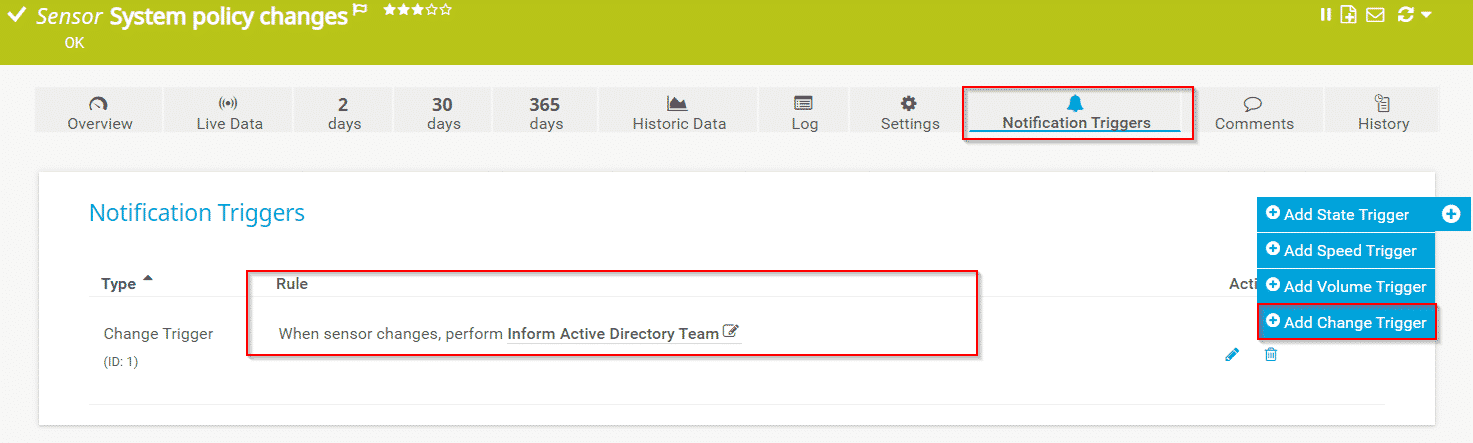
Your sensor is added. In order to get the notification in case of new event entries, you will need to create a notification trigger. Navigate to the sensor, click on Notification Triggers and add Change Trigger. In my case, if sensors get new entries, PRTG will send a notification to the Active Directory team by using notification template Inform Active Directory Team via ticketing system, email, SMS, push notification, or others.
Repeat the procedure for other event IDs. Please note that by using Event Log (Windows API) you can enter a comma-separated list of event IDs to add more than one ID to the filter. You can configure notifications for several event sensors by using Multi-Edit or Libraries.
Something happens on your Active Directory server(s), you will know it. Thank you for reading this article. In case of any questions, feel free to comment or contact me.

Andrew
June 3, 2021 at 08:45
Hi great use case, do you have any benchmarks on “too many” IDs filtered in a single WMI sensor?
Also my understanding is that WMI is expensive, do you see performance issues with this use case?
Jasmin Kahriman
June 26, 2021 at 17:56
Hi Andrew – Thank you. I haven’t experienced any performance issues with this use case. However, for all others metrics (CPU, RAM, HDD, etc), I´d recommend you using SNMP sensors.
Dan Reynolds
June 9, 2021 at 16:14
I like this simple and looks to be effective. I have implemented it and I’m getting some repeat offenders, look to be false positives. Is there any way to “filter” some of the false positives out of the mix? I have a 3rd party service that logs in and checks the printers for counts and supplies and then sends that information to the printer supplier. Think it would be possible to filter those out?
Jasmin Kahriman
June 26, 2021 at 18:02
Hi Dan – Thank you. The only way to filter them out is to exclude them from monitoring. (e.g. Filter by ID – Exclude).
Jasmin Kahriman
November 19, 2021 at 19:05
Thank you, Kazeem. You can do the same using relevant events IDs for Windows DNS.
Jose
July 11, 2022 at 12:33
Hi Jasmin Kahriman.
Is there any way to check the locked or expired accounts on the domain?
Jasmin Kahriman
August 19, 2022 at 20:49
Hi Jose – You can do it using a custom advanced exe sensor. However, you need to create a script.