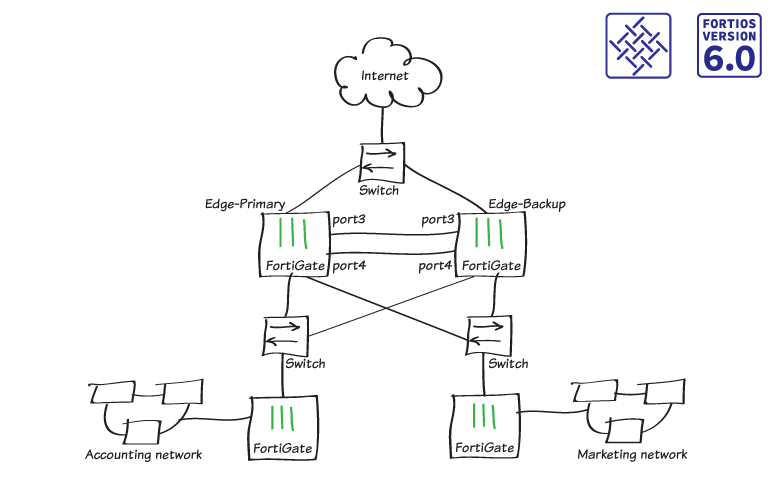
One of the ways to improve network reliability is to implement high availability. FortiGate provides you with a feature to implement active-active or active-passive clusters – depending on your needs.
There are some requirements to configure clusters such as the same FortiOS and static IP address.
The topic of this article is not about configuring the FortiGate cluster but monitoring the FortiGate cluster with PRTG.
For writing this article, I run my workloads on powerful mini PC - Intel NUC powered with the CPU i7 the latest generation, 64 GB RAM DDR4, 256 M.2 SSD. Intel® NUC Mini PCs are fully complete and ready to work out of the box. You can learn more here Intel® NUC Products.There are no native sensors named FortiGate cluster, however, there is a trick on how to do it. The cluster status value can be delivered using SNMP.
- Log in to your PRTG web UI
- Navigate to your FortiGate device.
- Add SNMP Custom table sensor and add the following OID
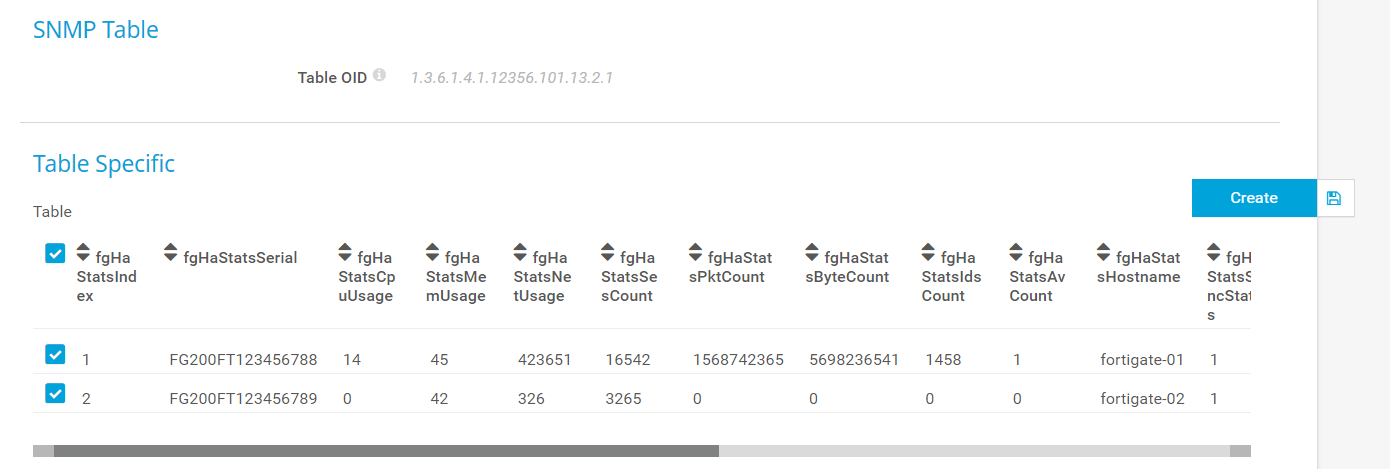
1.3.6.1.4.1.12356.101.13.2.1- PRTG will do a meta scan and show you what cluster nodes are available (if any). As you can see in my case, there are two cluster nodes available. I will select both of them.
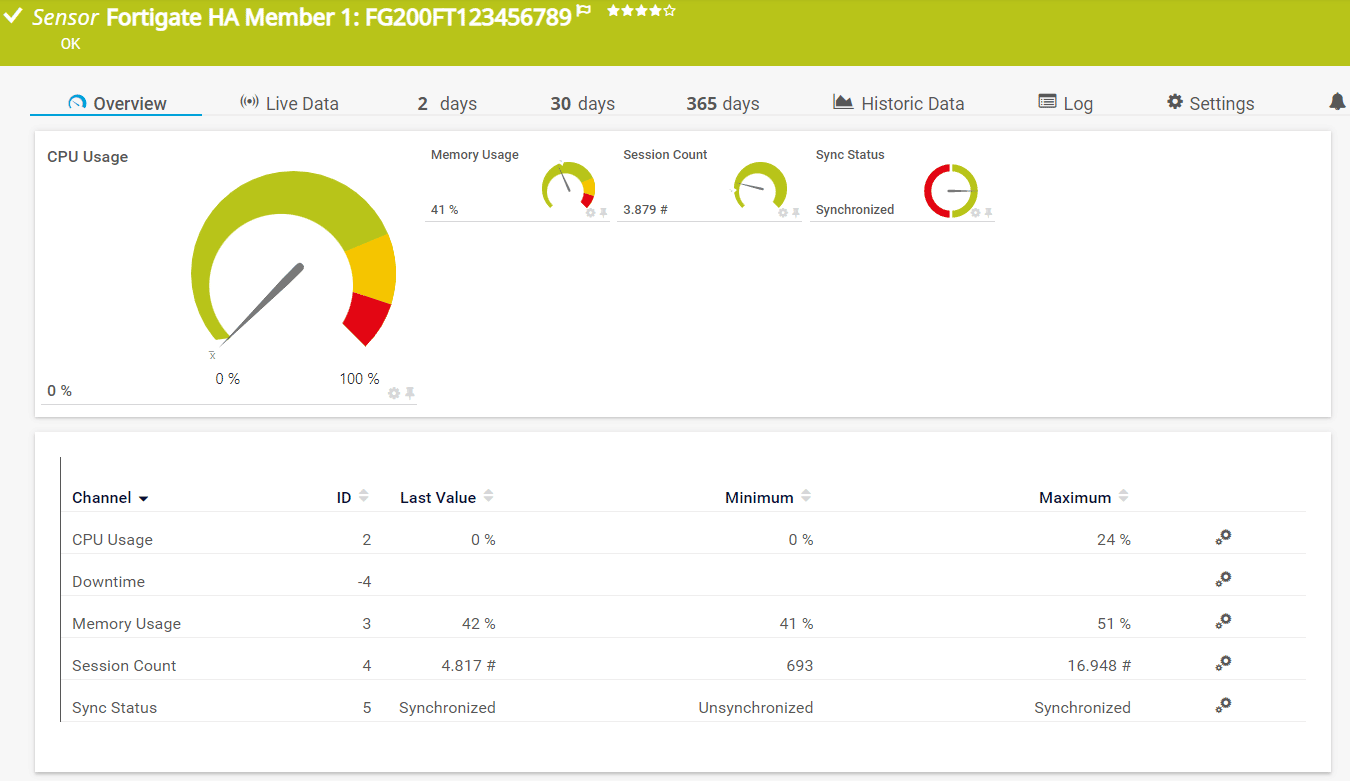
- PRTG will create one for each node one sensor. Based on the screenshot above, two sensors will be created. This sensor will show CPU and memory usage, session count, and sync status.
This was easy. Isn’t it!?
If you feel this article was helpful, please share it with your network.
Other FortiGate articles:
Thank you for your time.


